
Reporting
Commission Audit report (available)
The Commission Audit report explains how the app calculated each amount. It prints one grouped section for each commission ledger entry. It reconstructs the amounts from stored data: the matched rule, method, rate, basis, gross profit, per-tier segments, overrides, and reversal cross-references. The report does not recalculate the amounts, so it reflects what you posted.
The report header shows the company, the generation time, the active filters, and the page number. Each entry section has three columns: Source, Calculation, and Audit and Corrections. A Calculation Detail table below the columns lists each stored detail segment in posting order. The table shows the tier, method, rate, basis segment, gross profit values, commission segment, and any override reason, user, and date. The column headings repeat when a table continues on a new page. An empty cross-reference prints blank, not zero.
Run it from search → Commission Audit. On the request page, filter by:
- Salesperson Code
- Plan Code
- Posting Date
- Entry No.
The report is read-only. Use it for finance/admin reconciliation and audit. The landscape layout fits a letter page. To save a PDF, choose Send to… → PDF Document on the request page. To print, choose Print.
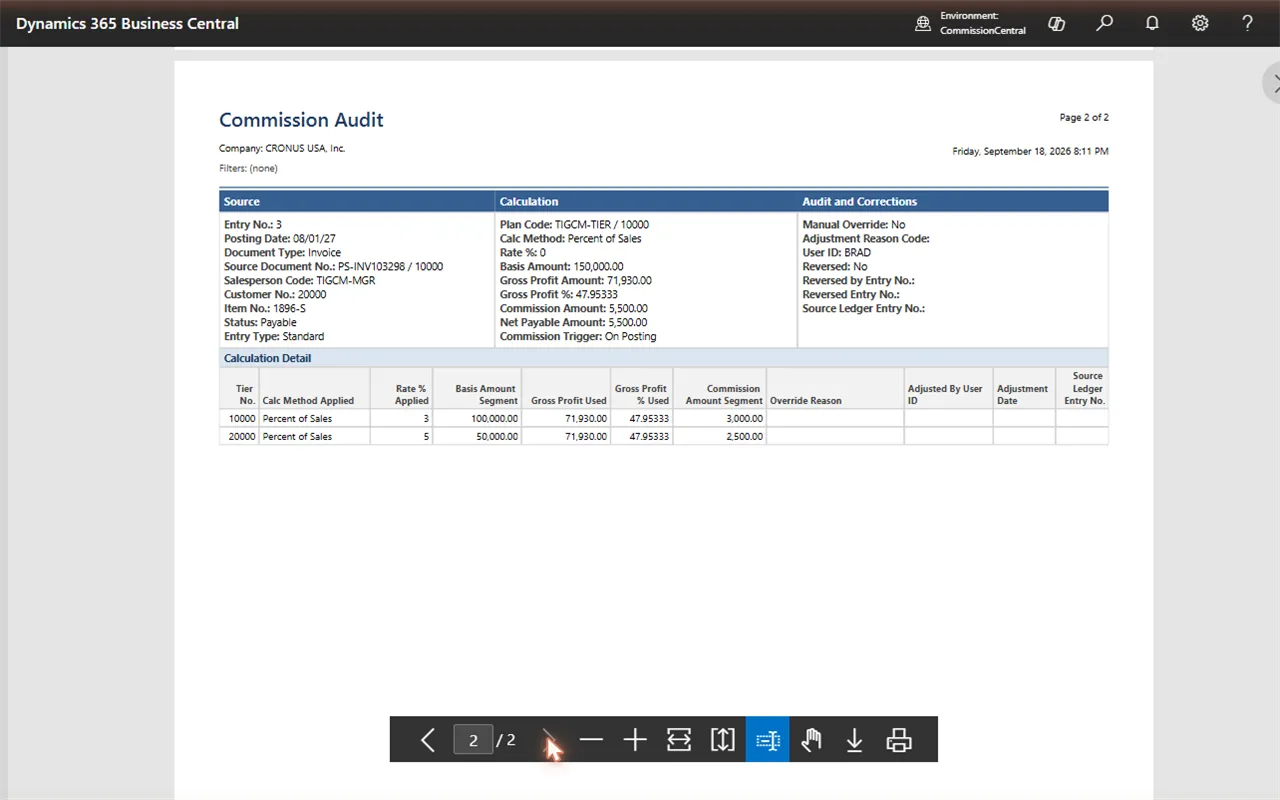 Figure: the first page of the Commission Audit report for a tiered entry.
Commission Summary report (available)
The Commission Summary report totals the commission ledger for each salesperson over a period. It shows the total basis amount, gross commission, draw advances, net payable, and the entry count. Each salesperson has a breakdown by commission status below the totals. The report ends with grand totals for all the entries you filtered.
Run it from search → Commission Summary. On the request page, filter by:
- Posting Date
- Salesperson Code
- Status
- Plan Code
Each filter works alone. You can also combine them.
The report sums the stored amounts. It calculates no commission again. A reversal or a downward correction carries a negative amount, so it reduces the totals. The report does not read the per-tier detail rows, so an entry with many tier rows counts one time.
Draw advances are separate. A draw advance stores a negative commission amount. The report puts it in the Draw Advances column and keeps it out of gross commission. This keeps the commission column a true record of what the agent earned.
A status filter gives you a lifecycle total, not an earned total. When a reversal offsets an entry that you already paid, the paid entry stays Paid and the offsetting entry becomes Reversed. The pair is zero in the salesperson total, but not in one status row. Leave Status empty to see net totals.
The report is read-only. To export the data, choose Send to… → Microsoft Excel Document (data only). In the export, the grand-total and company columns repeat on each row. Do not add them together.
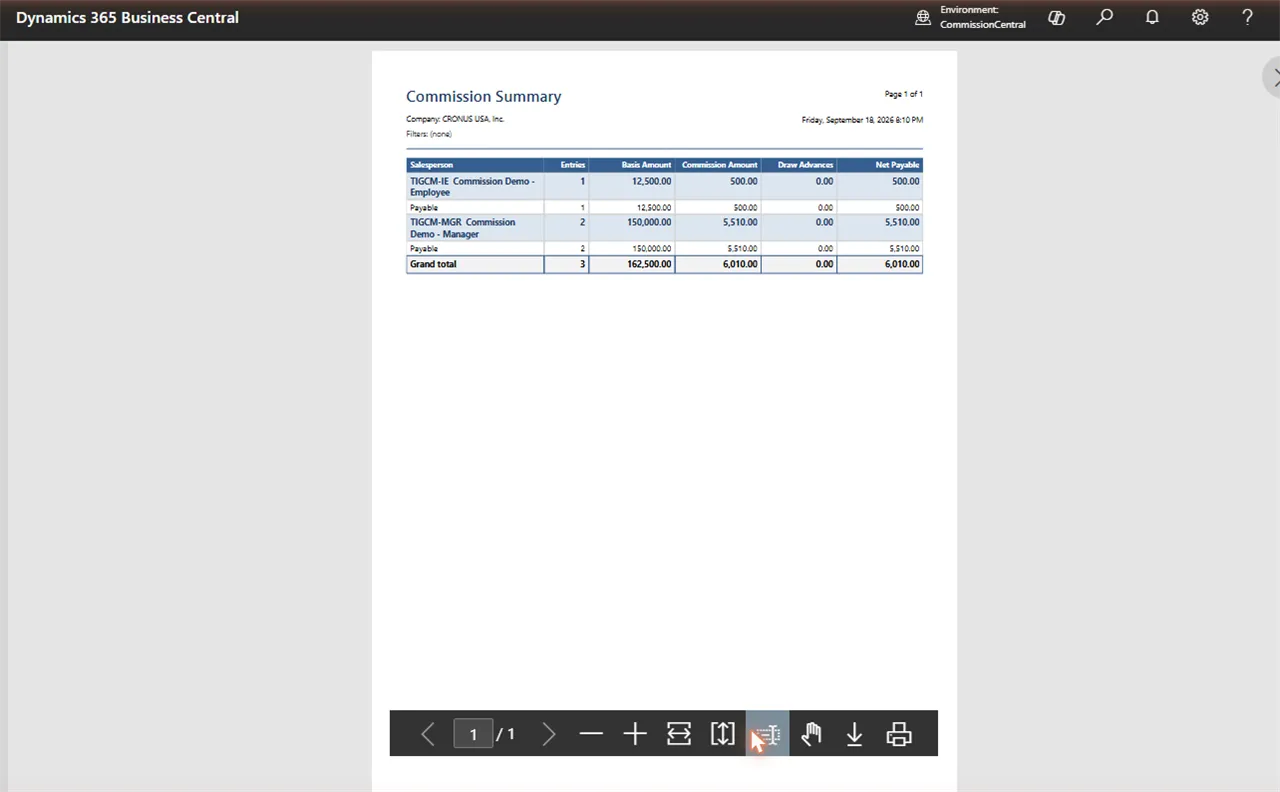 Figure: the Commission Summary report for two agents with a status breakdown.
Payment Batch Test report (available)
The Payment Batch Test report is the document that you review before you post a payment batch. It prints the batch header, and each batch line with the commission ledger entry that the line settles. It also prints a subtotal for each agent and a grand total. It then lists each condition that would stop the post.
When you print more than one batch, the report groups the lines by batch. Each block of lines starts with its batch number, and the subtotals and the total below it apply to that batch.
Run it from search → Payment Batch Test. You can also run it from the Test Report action on the Payment Batch card and on the Payment Batches list. On the request page, filter by:
- No.
- Status
- Posting Date
The report lists the problems that it finds. It does not cause them, and it changes no data. A batch that fails several conditions still prints a complete document, so you see all the problems in one pass.
For the full list of conditions, and for the two warnings that do not stop the post, see Payments.
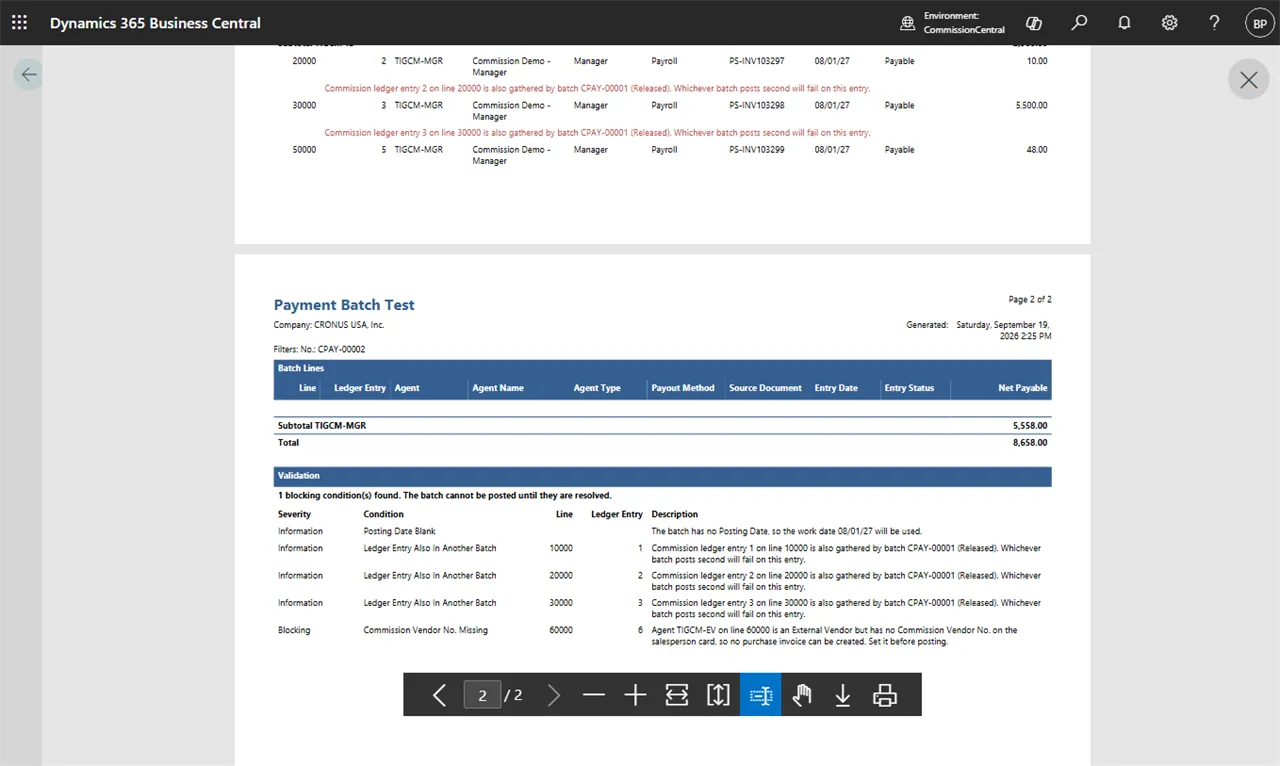 Figure: the Payment Batch Test report for a released batch, with per-agent subtotals and one
blocking condition listed.
Figure: the Payment Batch Test report for a released batch, with per-agent subtotals and one
blocking condition listed.
Live roll-ups (available today)
You do not need a report for at-a-glance balances. The Salesperson/Purchaser card shows live, ledger-backed totals for each agent:
- Outstanding Commission
- Payable Commission
- Paid Commission YTD
The CommissionCentral role center also shows company-wide activity cues — Commission Payable, Outstanding, Paid this month, Active Plans, Agent Assignments, and Open Payment Batches. Each cue opens the matching list.
On the roadmap (not in this release)
The broader Reporting & BI area is planned but not part of this release:
- Manager dashboard — team totals (outstanding / payable / paid), the top performer, and YTD-by-rep with drill-down.
- Commission detailed report — each entry with its rate, method, tier, and gross profit.
- Commission vs. target report — each agent’s target against the actual commission.
The following are deferred beyond V1:
- Salesperson self-service portal (and the related per-rep row isolation).
- Power BI dataset / OData feed.
This page grows when the dashboard and the other two reports ship.